Introduction
The objective of this guided exploration is to guide you through your
first steps in using Thermoptim to study a building air conditioning
cycle.
The software package has indeed the functions allowing moist gas
calculations to be carried out.
The case most often encountered in practice is obviously that of humid
air at atmospheric pressure, and Thermoptim allows many air
conditioning problems to be solved. But, more generally, it makes it
possible to study moist gases of any composition.
Note however that the air conditioning calculation functions in
Thermoptim do not have a graphic representation in the diagram editor.
Calculations are carried out in processes of a particular type as well
as in a specific mixer.
These processes all model changes undergone by the humid air, with the
exception of the determination of the supply conditions, which,
although carried out in a process, simply corresponds to the
calculation of the state to be obtained at the end of the air
treatment.
Another particularity is that the flow rates are related to dry air.
In this guided exploration, we offer you the following steps:
- Presentation of the problem specifies the data of the problem and explains the principle of air treatment
- Detailed resolution explains the configuration of all the model screens
- Plot of cycle in the psychrometric chart shows how to visualize cycle in diagram (w, t)
- Appendix Moist gases in Thermoptim reminds you of how moist gas calculations are performed in the software package, starting with the calculations of a point, then examining the different types of moist processes that may be used in our model.
Presentation of the problem
Objectives pursued
The installation that we are going to study corresponds to an airport, located in a hot and humid place, which one wishes to air-condition.
One seeks to maintain the internal ambience of a building at a
temperature of 24 °C (297.15 K) and a relative humidity equal to 50%.
External climatic conditions are the following: temperature to equal
30 °C (303.15 K), and relative humidity of 80%.
It is necessary to remove external and internal thermal loads of 162.6
kW, as well as a quantity of water equal to 60 kg/h, that is 0.01667
kg/s.
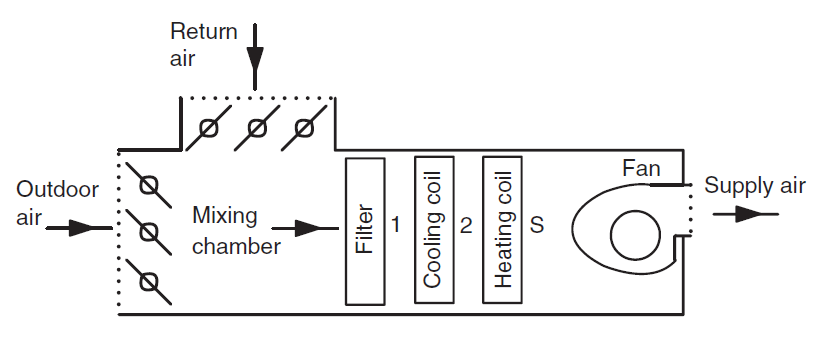
Principle of air treatment
For this, we have a ventilation circuit that allows air to be blown in different places of the building.For hygienic reasons, it is necessary to renew the air, but a part can however be recycled, which makes it possible to reduce the need for air conditioning.
Part of the indoor air is therefore recycled, which is mixed with the outdoor air. This mixture must be treated before being injected into the ventilation circuit, so that its state corresponds to the supply conditions.
These are calculated so that the internal and external thermal loads are evacuated, as well as the quantity of water corresponding to the internal contributions. In addition, for reasons of hygiene and comfort, the supply temperature should generally not be lower than a certain value.
A possible treatment of the mixed air is to cool it, condensing water in excess to obtain specific
humidity corresponding to the supply conditions, then warm it to supply temperature according to the diagram below. There are
others, but we will present this one here.
Detailed resolution
Loading the model is done by opening the diagram file and a properly configured project file.
Start by loading the model, then complete the other suggested activities.
Load the model
Click on the following link: Open a file in Thermoptim
You can also:
- either open the "Project files/Example catalog" (CtrlE) and select model m12.1 in Chapter 12 model list.
- or directly open the project file (aircond_Summer.prj) using the
“Project files/Load a project” menu in the simulator menu.
There is no need to open a diagram file because there is none for moist processes.
Determination of supply conditions
For reasons of hygiene and comfort, the discharge temperature must
not be lower than 14 ° C, and the proportion of recirculated air must
not exceed 70%.
To be able to determine the supply conditions, it is necessary, as
shown in the diagram of the treatment system, to mix the outside air
and part of the recirculated indoor air.
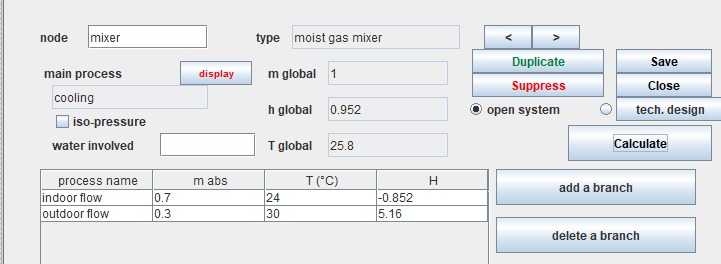
The modeling of this mixture is done using a moist mixer which
receives as input two process-points representing these two air flows.
Open this mixer by double-clicking on the row of the node table
located at the bottom left of the simulator screen.
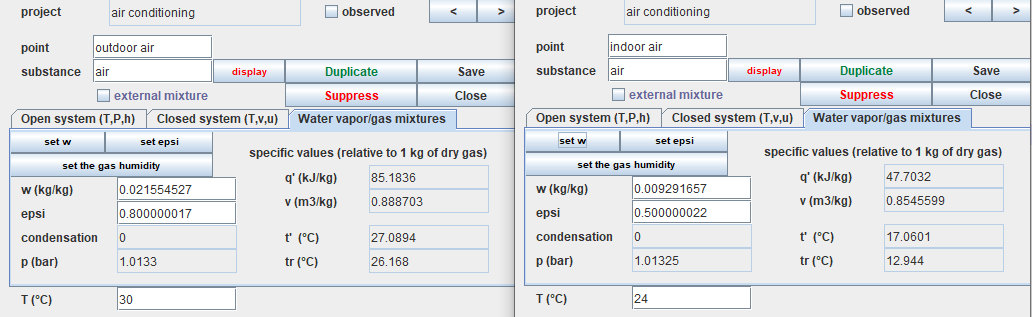
The setting of the two points for determining the conditions of the outdoor air and indoor air is given below. Remember that in order to get these results you have to open the points by double-clicking on their row in the simulator point table, then you have to click on the "Water vapor/gas mixtures" tab and click on the "set w" button, because, when Thermoptim is opened, these calculations have not yet been carried out.
- the outside air has a relative humidity epsilon of 80% and a temperature of 30 ° C
- indoor air has a relative humidity epsilon of 50% and a temperature of 24 ° C
We have entered the values of 0.3 and 0.7 as flow rates in the two process-points at the inlet of the mixer, so that the proportion of recirculated air is equal to the limit value of 70% indicated above.
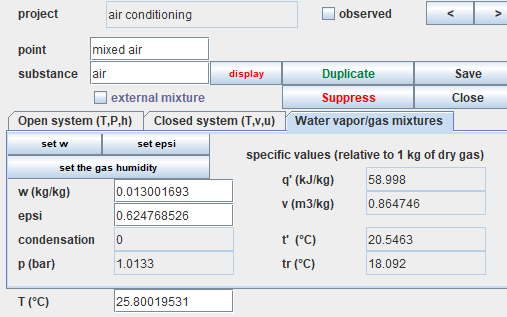
Calculate the moist mixer, then open the "mixed air" point.
Its temperature is 25.8 ° C and its humidity w is equal to 0.013 kg of
water per kg of dry air.
Now that we know its properties, we will be able to determine the
supply conditions.
A specialized design office has previously determined the internal and
external thermal inputs that must be removed. They correspond to a
power of 162.6 kW and a quantity of water equal to 60 kg / h, or
0.01667 kg / s.
Open the supply process by double-clicking on its row in the process
table.
You will find these two values in the "water load" and "thermal
load" fields located in the center of the screen, affected by a
negative sign because they are loads to be extracted from the
building.
![]()
When the supply process is calculated, it determines on the one hand
the humidity of this point, and on the other hand the flow rate of dry
gas necessary to compensate for the water and thermal loads.
The problem now is how to treat the mixed air (25.8 ° C, w = 0.013) to
obtain the supply conditions (14 ° C, w = 0.00792).
As we said, one solution is to cool it until its specific humidity is
equal to that of the supply air, then reheat it to achieve the desired
temperature.
Cooling process calculation
In the point "cooled air" downstream of the "cooling" moist process, we start by entering w = 0.00792 as specific humidity.
In the "cooling" process, let us choose a realistic cold coil surface
temperature (for example 7 ° C), take as flow the supply flow rate
calculated previously, and choose the calculation mode so that
Thermoptim searches for the required battery effectiveness.
The process can be calculated.
![]()
We obtain the following results: the temperature of the cooled air is equal to 11.73 ° C, and the effectiveness of the cold coil is 75.1%.
Heating process calculation
Now that the cooled mixture is at the correct humidity, it suffices
to reheat it slightly to obtain the desired supply conditions.
To determine the temperature rise to be provided, open the "heating"
moist process connecting the "cooled air" point and the "supply"
point. Its flow rate is the same as that of the "supply" and "cooling"
processes.
![]()
Its only setting is the choice of the calculation mode, here "Calculate the process, the downstream point being known".
Plot of the cycle in the psychrometric chart
First step: loading the psychrometric chart
We will now study the cycle in the psychrometric chart.
Click this button
You can also open the chart using the line “Interactive Charts” of
the “Special” menu of the simulator screen, which opens an interface
that links the simulator and the chart. Double-click in the field
located at the top left of this interface to choose the type of
chart desired (here “Psychrometric”).
Once the chart is open, select “(w, t)” in the “Chart” menu, and
click on the line “Load a base gas” in the Gas Editor menu, and
choose “air” among the Protected compound gases.
If the window is displayed correctly, but without showing the
iso-value lines of the chart, it is undoubtedly that the display
interval of the values is not the right one, because of previous
settings.
It is possible to modify the calculation and display values by
adjusting the parameters in the chart menus:
- Open the Chart/ X Axis menu line, then enter a minimum of 10 and a maximum of 35 to define the temperature values to be displayed
- Open the Chart/ Y Axis menu line, then enter a minimum of 0.005 and a maximum of 0.025 to set specific humidity values to display
- If the iso-values lines are not the correct ones, open the Graph / parameters menu line, then enter the following values to define the iso-values to display:
- Dry temperature between 0 ° C and 50 ° C
- Pressure 1.01325 bar
Second step: loading a pre-recorded cycle corresponding to the loaded project
You can open this cycle as follows: in the chart window, choose “Load a cycle” from the Cycle menu, and select “climEte_Fr.txt” from the list of available cycles. Then click on the “Connected points” line of the Cycle menu.
 This image
calls for several comments.
This image
calls for several comments.
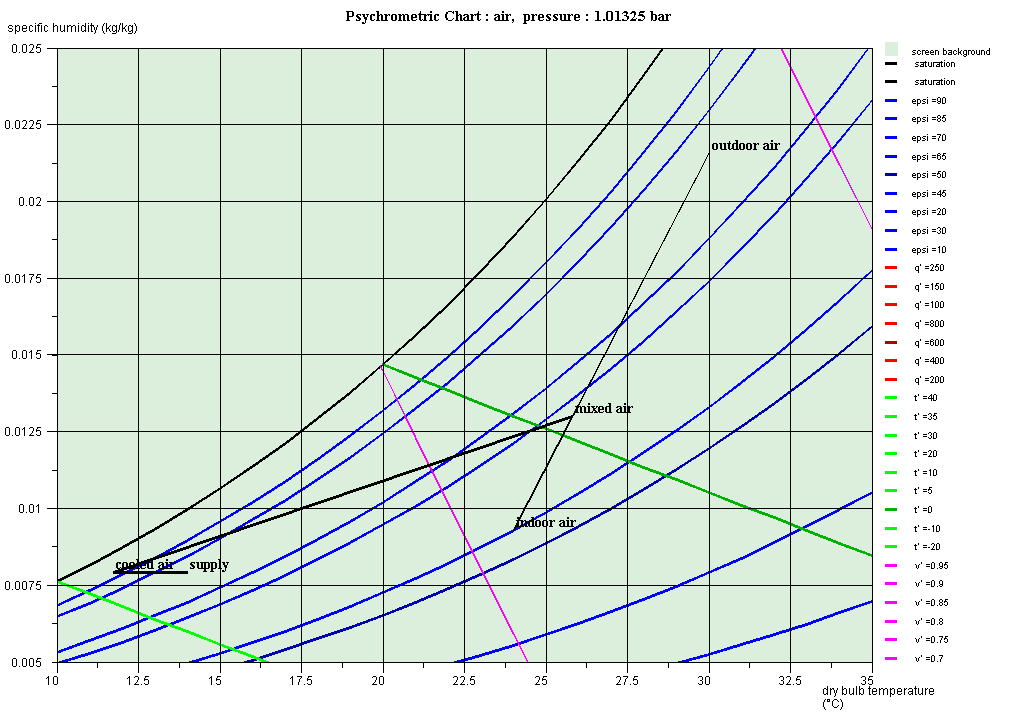
The air treatment cycle is shown in the chart, with the mixed air
properly located on the mixing line which connects the indoor and
outdoor air.
Cooling with a drop in the specific humidity of the air is represented
by the line which connects the mixed air to the cooled air, the
leftmost point of the cycle.
Finally, heating at constant specific humidity corresponds to the
small horizontal line segment in the lower part of the cycle, on the
left, which ends at the "supply" point.
Appendix: moist gases in Thermoptim
General principles
A moist gas can be represented in THERMOPTIM in two equivalent ways: either directly as a compound substance comprising at least two constituents: H2O and another gas, pure or compound, or as a dry gas for which we know the specific humidity.The first way has the advantage that the composition of the moist gas
is accessible at all times. On the other hand, it assumes that, for
the same dry gas, a new moist substance is created for each value of
the relative humidity.
The second representation is much more concise, since it only uses the
invariant gas and the value of the specific humidity.
Calculation of the properties of a point represented by a moist gas
The "Water vapor/gas mixtures" tab of the points screen allows you to calculate the properties of moist gases.
When the gas is represented by a moist substance , the latter may have
been mixed in a mixer, generated from a dry gas and a specific
humidity, or even defined directly by the user, in which case care
should be taken that water has been defined as gas (H2O). Let us, for
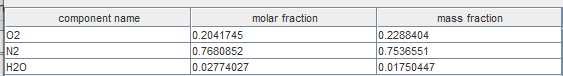
example, consider humid air, the composition of which is as follows:
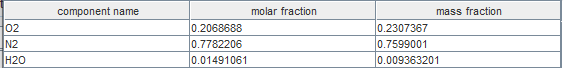
Construct a point using this substance , at the pressure of 1 atmosphere and the temperature of 35 ° C, and click on the tab titled "Water vapor/gas mixtures". The following screen appears:
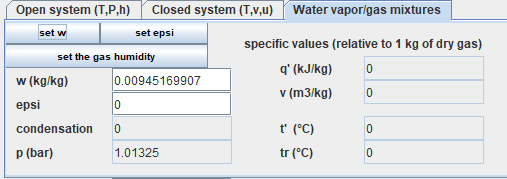
On the left appear the data relating to the point considered: specific humidity w, relative humidity epsi. On the right are indicated the specific values (that is to say related to 1 kg of dry gas) of the enthalpy, the volume, as well as the moist bulb temperature and dew point temperature. Any condensate is displayed on the left below the relative humidity.
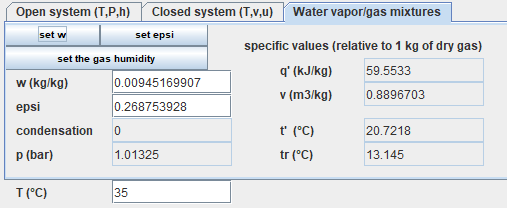
Calculation of moist characteristics
To calculate all the moist characteristics of the point, click on the "set w" button. The following results are displayed:
Setting relative humidity
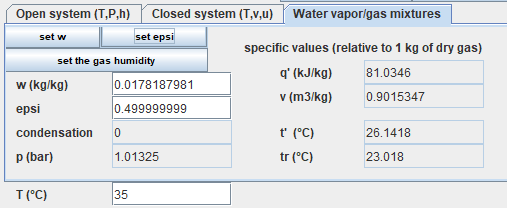
It is also possible to set a particular value of the relative humidity, by entering this value in the corresponding field, then by clicking on the button "set epsi". Suppose we set a relative humidity equal to 0.5: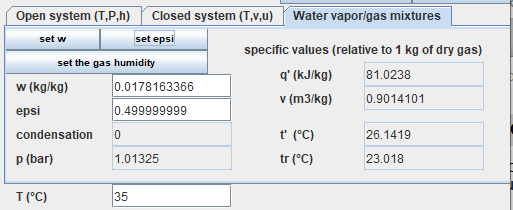
Calculation of the properties of a point represented by a dry gas
The composition of the dry gas being most often invariant, we have
seen that it is interesting to define a moist gas by referring to its
dry gas. As a departure from the general rule used in the software
package, THERMOPTIM allows this to be done by constructing points
defined by the dry gas and the value of the specific humidity.
By way of example, thus construct a point of pressure 1 atmosphere and
temperature 35 ° C, associated with the substance "atmospheric
air", then click on the "Water vapor/gas mixtures" tab, and set as
before a relative humidity equal to 0.5. The result you get is the
following, identical to the previous one except for rounding:
Moist process screens
To study the changes that a moist gas can undergo, a "moist" process has been introduced. In fact, it corresponds to six different processes, which are distinguished by their category. The screens of the moist processes look like this, but they vary slightly depending on the category chosen:
![]()
Before detailing how to use this screen, let us specify a few points
which apply to all moist processes.
First of all, THERMOPTIM only performs process calculations between
moist points insofar as these points are represented by their dry gas
and their humidity. The reason is simple: this mode of representation
avoids having to introduce a new moist substance for each value
of the humidity.
It should be noted that this way of doing things is quite exceptional
in THERMOPTIM: for all the other processes, the calculations are made
from the precise composition of the substance considered. If
therefore couplings have to be made between moist processes and other
processes, care must be taken to interconnect them by moist
substances.
Moreover, the quantities being preferably expressed in specific units, the flow rates which appear on the processes are the dry gas flow rates.
The notion of effectiveness is often used to qualify real processes
compared to theoretical or ideal processes. In practice, the latter
generally correspond to evolutions whose final state is saturated
(complete humidification, cooling to saturation).
The upper right part of the screen recalls the general characteristics
of the process, while the left part displays the upstream and
downstream points, with indication of their temperatures, pressure,
specific enthalpy and specific humidity.
The settings for the different categories of moist processes, and the
calculation options are located in the central and lower right area.
Supply process
This process connects the point describing the known indoor environment (upstream point) to the point corresponding to the desired supply conditions (downstream point).![]()
The fields to the right of the screen are used to enter the water and heat loads to be discharged, in kg / s and kW respectively. It is assumed that the water load must be discharged at the temperature of the indoor point.
Thermoptim then calculates the values on the one hand of the "slope ratio gamma", which represents the ratio between the variations of specific enthalpy and humidity, and on the other hand of the total enthalpy Delta Q' involved in the process (on the basis of specific enthalpies).
Two actions are possible here:
- either determine the temperature and specific humidity of the supply point, the dry gas flow being known.
- or, the supply temperature being considered as set, determine the specific humidity of the supply point, as well as the dry gas flow rate required.
Cooling process
This process makes it possible to study the cooling of a humid gas on
a cold coil, with or without condensation.
![]()
Two actions are possible here:
- the effectiveness being set, calculate the humidity of the downstream point. In the event of anticipated condensation (case where the straight line connecting the upstream point to the point of the saturation curve at the surface temperature intersects the saturation curve at two points), the downstream point is sought on the saturation curve, its enthalpy being calculated from battery effectiveness.
- the humidity of the downstream point being set, calculate its temperature and the effectiveness of the battery. In the event of anticipated condensation (see above), the downstream point is sought on the saturation curve, for the specific humidity desired.
Water / steam or adiabatic humidification process
These two types of processes make it possible to study either humidification with water or steam, or adiabatic humidification.![]()
Two actions are possible here:
- the effectiveness being set, calculate the humidity of the downstream point. In the event of anticipated condensation (case where the straight line connecting the upstream point to the point of the saturation curve at the surface temperature intersects the saturation curve at two points), the downstream point is sought on the saturation curve, its enthalpy being calculated from the effectiveness of the humidifier.
- calculate the downstream point to obtain the desired humidity. In the event of anticipated condensation (see above), the downstream point is sought on the saturation curve, for the specific humidity desired. The effectiveness of the humidifier is then calculated.
Heating process
This process makes it possible to carry out various calculations of changes undergone by a moist gas. Depending on the case, the water content of the two points may be the same or different.
![]()
- calculate the Delta H, the upstream and downstream points being assumed to be known.
- determine the state of the downstream point, the enthalpy variation and the water involved being assumed to be known.
Dessication process
This process makes it possible to study dehumidification by
desiccation or the regeneration of a desiccant.
Different types of desiccant materials are available, their name and
heat of sorption being displayed on the right of the screen, the
latter can be modified if the user wishes.
![]()
- the temperature of the downstream point being assumed to be known, calculate its humidity.
- calculate the temperature of the downstream point to obtain the desired humidity.
Moist mixer
This node is used to determine the moist properties of a mixture of several dry moist gases.
- first of all, it accepts both moist and non-moist processes as input branches. Since the flow rate of the moist processes is that of their dry gas, the moist mixer makes the necessary corrections.
- then, its main vein must be a moist process. If not, a message warns the user, and the calculations are made as if it were a simple mixer.
Usually the downstream point is on the mixing line. In the event of
oversaturation, a message informs the user and Thermoptim searches for
the mixing point on the saturation curve, while ensuring the
conservation of the enthalpy. The excess water is then displayed above
the branch table.
The values displayed are not expressed in relation to dry gas.